|
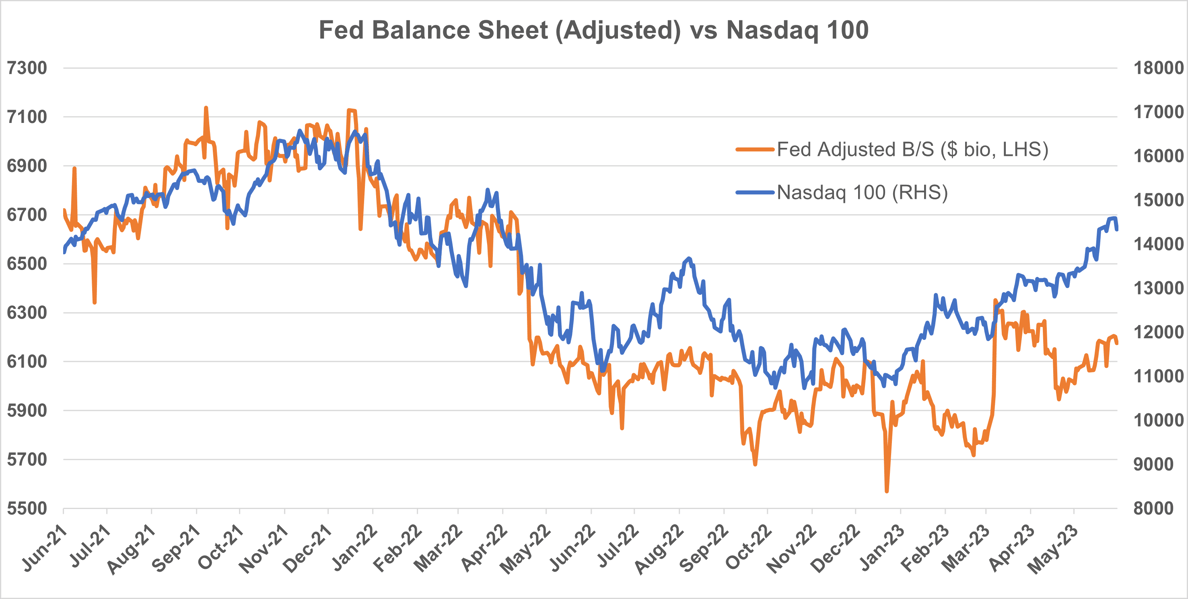
In our update from 22 February 2023, IVI highlighted that as the US reached the debt ceiling, the US Treasury’s own reserves, held in the Treasury General Account (TGA) at the Fed, would need to be drawn down to fund government spending. The TGA run down from USD 490bio on 22 February to just USD 23bio on 5 June effectively injected additional liquidity into markets. This countered the effect of Quantitative Tightening (QT) as the Fed shrinks its balance sheet, albeit at a far slower pace than it was expanded. In effect, this acted as a stimulus on markets still suffering from an excess of liquidity generated by unprecedented expansion of US fiscal spending and the Fed’s balance sheet in response to Covid. Now the debt ceiling impasse has been resolved, the TGA will need to be rebuilt. Treasury has indicated this will be done by issuing bills, and we estimate the rebuild will be approximately USD500 billion over the next 3 months (most occurring in June/July). In addition, we are projecting the heavy seasonal deficit over that time frame to be USD600 billion, which also needs to be financed. This implies roughly USD1.1 trillion in new net marketable borrowing by Treasury. The chart below shows the relationship between Nasdaq 100 (in blue) and our liquidity gauge using the Fed’s Balance Sheet adjusted for both RRP (Fed’s reverse repo facility) and TGA (in orange). Note in December 2021, the Fed’s adjusted balance sheet started to contract from a peak of USD 7.1trillion and Nasdaq peaked too and began to fall. But, since October of 2022, the adjusted Treasury balance sheet has RE-EXPANDED as the US government’s cash balances (TGA) have been run down. Now the agreement has been reached, this liquidity tightening risks a more rapid slowdown in the US economy in the second half of 2023, very much at odds with the current market pricing of immaculate disinflation and much lower volatility.
|