C8 Monthly Update – July 2019 |
|
|
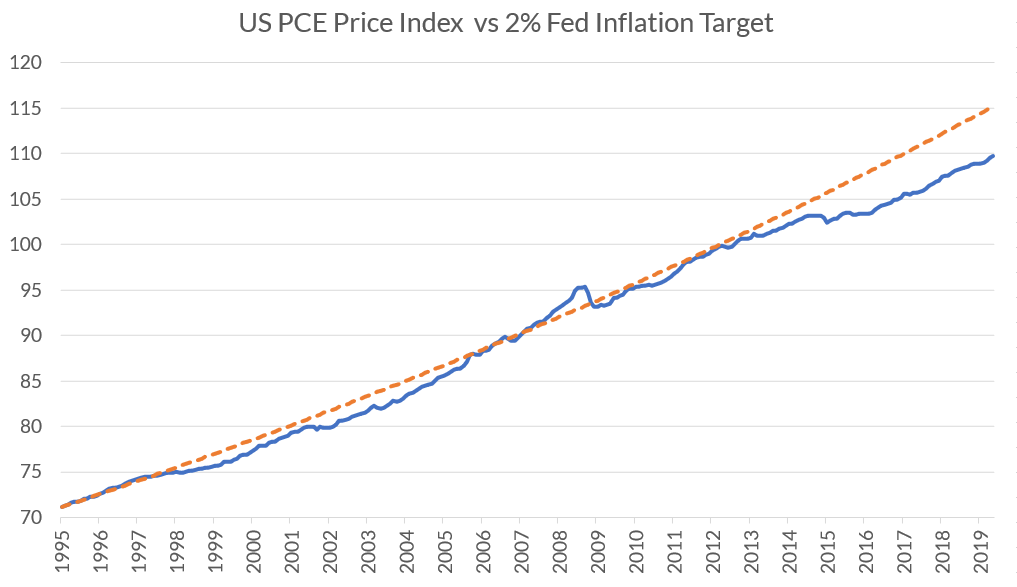
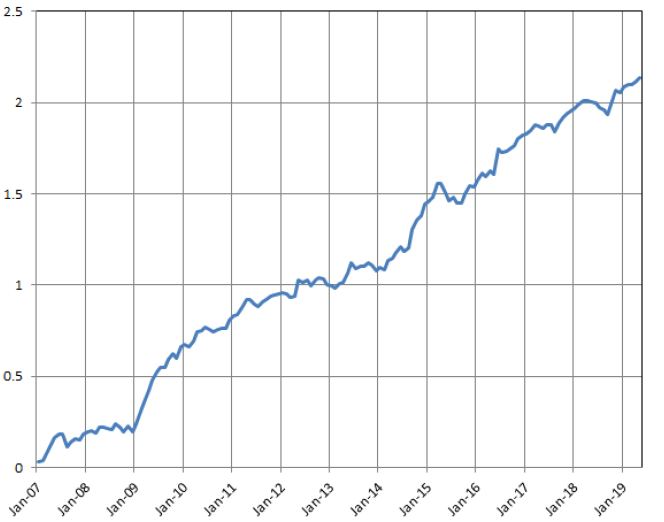
With US unemployment at a 50 year low and US equity markets at all time highs, why will the US Fed be cutting rates? |
 |
|
The most interesting chart that we saw last month is shown above, it is from David Zervos, head of market strategy and ex-colleague at Jefferies. This compares the US Personal Consumption Expenditure Price Index (blue line) since 1995 with the US Fed inflation target (orange line). From 1995 to 2012, the Fed was broadly successful in targeting 2% inflation, however since then, inflation has consistently undershot their target (ironically, 2012 was the year when the Fed announced a formal 2% inflation target). According to Zervos, if the US is unable to lift inflation, the Fed’s credibility to fight the next economic downturn will be compromised as lower rates or QE will have less impact on inflation expectations. On that basis, the time for action is now. This goes a long way to explain why the Fed has been so consistently dovish this year, as, for example, in Chairman Powell’s testimony last week. |
|
|
We have launched a US Equity Hedge IndexThe dovish Fed has led to new highs in US equity markets. However, if a client has concerns about an equity market correction, it has always been possible to hedge a long equity portfolio with equity futures such as the CME’s S&P500 contract. The downside to this approach is that any gains or losses are symmetric, resulting in significant equity portfolio underperformance if equity markets continue to make gains. This is where our new US Equity Hedge Index comes in. The creator, Larry Jones, has spent many years grappling with this important hedging issue, including 8 years as head of portfolio management at AXA Investment Managers. If you want to hedge equity risk, what is an efficient way to achieve this? The C8 Equity Hedge Index is designed to most efficiently capture an equity market decline of 3-5% over 4-6 weeks, using a combination of put options on the S&P 500 index futures. Position sizes and strike prices are driven by systematic rules that have been developed over Jones’s many year’s experience of active portfolio hedging. With the flexibility of the C8 platform, a client can access this hedge index as and when they need it, delivering an asymmetric risk profile of outsized returns in a downturn against limited loses if equity markets continue to rally. |
 |
|
|
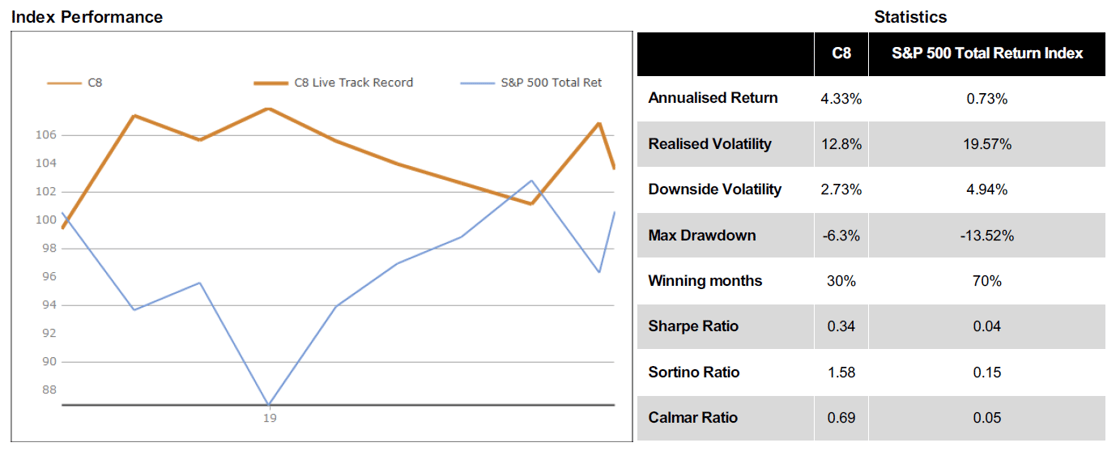
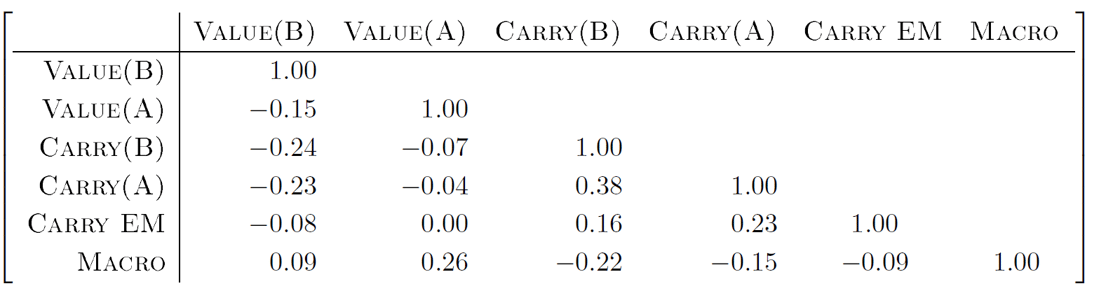
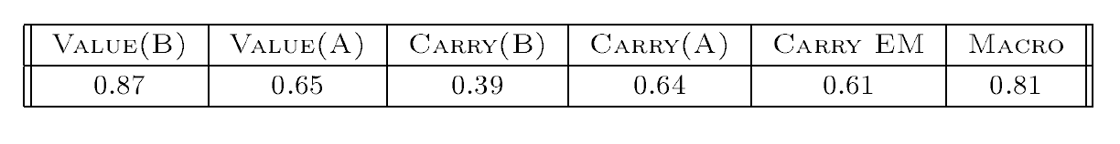
The Power of Combining IndicesCombining Indices in C8 Studio is a powerful tool, especially across different asset classes which have quite uncorrelated returns. However, we have noticed that even in the same asset class, combining Indices from different Index providers can provide an strong risk/return profile. Outside of the C8 ecosystem, a client would have to deal separately with each Index provider but on the C8 platform, there is just one agreement, allowing access to all providers. A good example is the combination (below) of FX Indices from three different providers. The first table shows the lack of correlation between the six chosen Indices, despite some having similar investment approaches, such as Value or Carry. Whilst each of the Indices has a Sharpe Ratio between 0.38 to 0.80 (see second table), the lack of correlation means that combining these Indices, on an equal vol basis, gives a Sharpe of 1.64 and a strong overall performance (see chart). A perfect illustration of the advantages of combining Indices on the C8 platform. |
 |
 |
 |
|
|
C8 Platform – Patent PendingC8 has developed a unique investment process that makes it straightforward for an asset owner to track the performance of an investment strategy. Trading the underlying instruments internally gives full control and transparency to your investments, whilst reducing costs. C8 is using cutting edge distributed ledger technology (blockchain) to provide full transparency in the delivery and usage of investment strategies. C8 has chosen Microsoft Azure Blockchain platform for implementation. This unique process is now protected via a patent pending status in preparation for a global patent. |
|
Thanks for reading, The C8 Team |
|
|
|
Please find below the June monthly performance tables for a selection of Indices on the C8 platform. There was a strong showing from Global Trend Following, the Rates Alternative Risk Premia (ARP) continue to perform well, as do US Factor Indices including ESG. This was topped by a very strong month for China ARP, which is trading live for our Chinese clients. |
 |
 |
|
|
| C8 Technologies, Michelin House, 81 Fulham Road, London, Greater London SW3 6RD, +44 (0) 20 3826 0045 |
 |