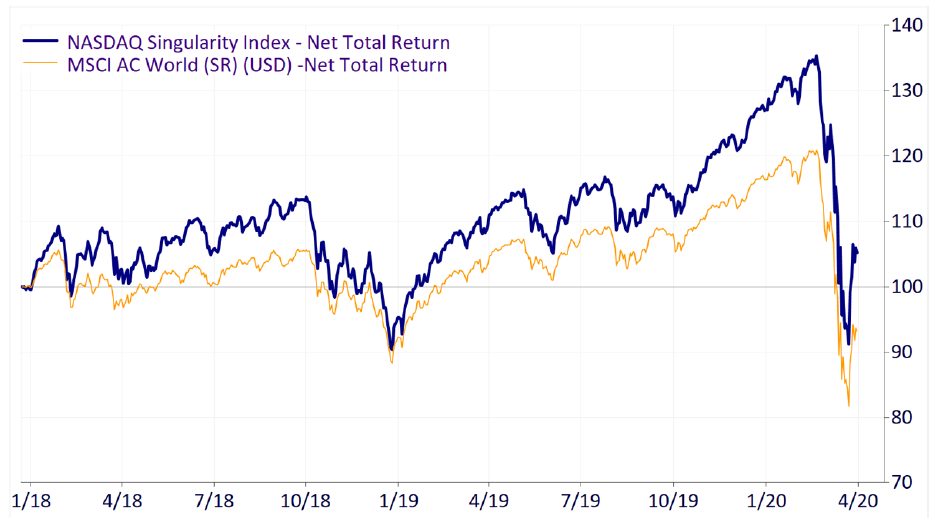
Seeking Singularity Performance March 2020
SINGULARITY PERFORMANCE – Q1 2020
Singularity Index SI (NQ 2045) vs. benchmarks: March was an extraordinary month by any measure with
financial markets crashing at an unprecedented speed. Despite staging an impressive bounce during the last
week of the month with the best three-day stretch since the 1930s, the Singularity Index declined by
-10.5%, but strongly outperformed the MSCI AC World Index (MSCI ACWI), which lost -13.5%. All markets
corrected heavily around the globe: S&P 500 -12.4%, MSCI Europe -14.3%, MSCI AC Asia Pacific -11.6%,
SMI -3.9%. On a YTD basis the SI is down by -17.2% vs MSCI ACWI (-21.4%), S&P 500 (-19.7%), MSCI
Europe (-22.6%), SMI (-11.0%), MSCI AC Asia Pacific (-19.3%). The correction marks the fastest decline on
record. It took the S&P 500 a mere 15 days to enter a bear market and drop by more than 20% from its
previous peak, trumping both the sell-off during the Great Depression in 1929 as well as the crash in October
1987.

Compared to the MSCI ACWI, the SI had positive contributions from both stock selection (+1.2%) and
sector allocation (+1.8%). In March, stock selection was most positive in Financials, Communication Services
and Materials, driven by relative overweights in Ping An Insurance Group, Nintendo, Rio Tinto, and Nvidia
relative to the MSCI ACWI, whereas overweights in Boeing, Airbus and Coca Cola detracted from returns. From
a sector perspective, overweights in Information Technology and Health Care as well as an underweight to
Energy were beneficial while an overweight in Industrials hurt performance. YTD and for Q1, stock selection
and sector allocation accounted for +2.1% each with respect to the outperformance vs MSCI ACWI.